Jobs up in majority of metro areas in January
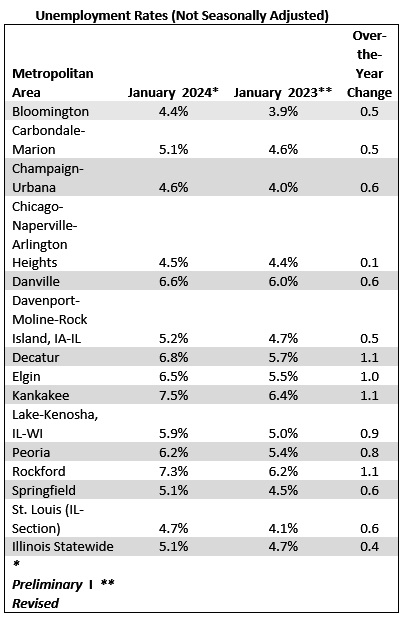
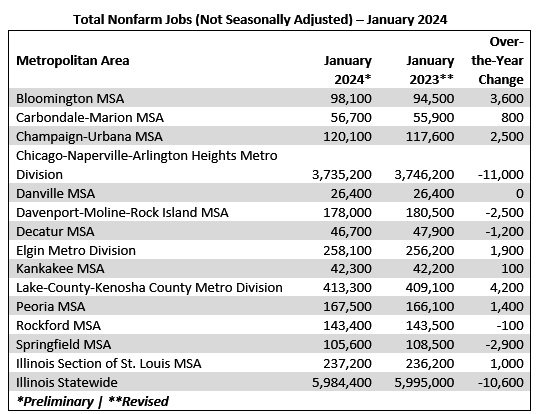
 Over-the-year, total nonfarm jobs increased in eight metropolitan areas, decreased in five and was unchanged in one for the year ending January 2024, according to data released on March 13, 2024, by the U.S. Bureau of Labor Statistics (BLS) and the Illinois Department of Employment Security (DES). Over-the-year, the unemployment rate increased in all fourteen metropolitan areas.
“As payrolls continue to grow across industries throughout the state, jobseekers are encouraged to take advantage of new and expanded employment opportunities,” said Deputy Governor Andy Manar. “IDES and its workforce partners are uniquely positioned to assist with employment searches and to match workers with employers to ensure they find the best fit for their needs.”
The metro areas which had the largest over-the-year percentage increases in total nonfarm jobs were the Bloomington MSA (+3.8%, +3,600), the Champaign-Urbana MSA (+2.1%, +2,500) and the Carbondale-Marion MSA (+1.4%, +800). The metro areas which had the largest over-the-year percentage decreases were the Springfield MSA (-2.7%, -2,900), the Decatur MSA (-2.5%, -1,200), and the Davenport-Moline-Rock Island IA-IL MSA (-1.4%, -2,500). Total nonfarm jobs in the Chicago Metro Division were down -0.3% or -11,000. Industries that saw job growth in a majority of metro areas included: Education and Health Services and Government (twelve areas each); and Financial Activities (eight areas).
The metro areas with the largest unemployment rate increases were in Decatur MSA (+1.1 points to 6.8%), the Kankakee MSA (+1.1 points to 7.5%), and the Rockford MSA (+1.1 points to 7.3%). The Chicago Metro Division unemployment rate increased +0.1 point to 4.5%.
South Central Illinois Highlights
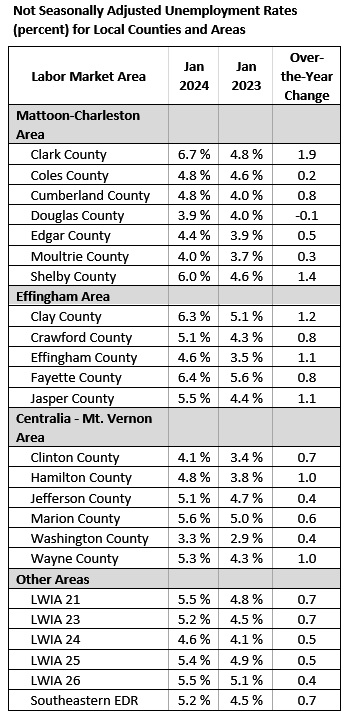
Mattoon – Charleston Area
Total nonfarm payroll employment increased by +925 jobs in January 2024 compared to a year ago.
Employment gains were posted in Educational-Health Services (+500), Government (+400), Professional-Business Services (+125), Leisure-Hospitality (+125), Construction (+50) and Other Services (+25).
No change in employment was reported among employers in the Natural Resources and Mining sector.
From January 2023 to January 2024, nonfarm payrolls decreased notably in the Manufacturing (-125), Trade-Transportation-Utilities (-50), Financial Activities (-50) and Information (-25) sectors.
Effingham Area
Total nonfarm employment increased by +25 in January 2024 compared to a year ago.
Employment gains were posted in Government (+275), Professional-Business Services (+250), Trade-Transportation-Utilities (+100), Leisure-Hospitality (+75) and Financial Activities (+50).
Year-over-year, payroll totals were unchanged among employers in the Other Services, Information and Natural Resources and Mining sectors.
Payroll job losses occurred among employers in the Educational-Health Services (-300), Manufacturing (-275) and Construction (-125) sectors.
Centralia – Mt. Vernon Area
Total nonfarm employment decreased by -250 jobs in January 2024 from a year earlier.
Employers in the Manufacturing (+125), Government (+100), Construction (+75), Natural Resources and Mining (+50) and Information (+25) sectors added jobs during the month.
No change in total employment was reported in Financial Activities during the year.
Payrolls decreased among employers in Professional-Business Services (-300), Trade-Transportation-Utilities (-225), Leisure-Hospitality (-50), Other Services (-25) and Educational-Health Services (-25) between January 2023 and January 2024.